
Kingston's average house price rose £19,128 in the year to July, the 2nd biggest gain in London while the city fell 3.3%. It still fell £3,682 on the month.
The average home in the Kingston upon Thames borough was worth £591,555 in July, up £19,128 on July last year. That is a rise of 3.3%, and only one of London’s 33 boroughs did better.
London as a whole fell 3.3% over the same year. England rose 1.1%.
The figures come from HM Land Registry’s UK House Price Index for July 2026, published this month. One thing to hold on to before anything else: UKHPI is a mean average, not a median. A handful of sales on Coombe Hill pulls it up in a way a typical Chessington or Tolworth sale never does.
Where Kingston sits
Only Barking and Dagenham, at 5.3%, beat Kingston over the year. Twelve of the 33 boroughs rose. Twenty-one fell, several of them heavily: Westminster is down 20.7%, the City of London 17.4%, Tower Hamlets 14.4% and Kensington and Chelsea 14.1%.
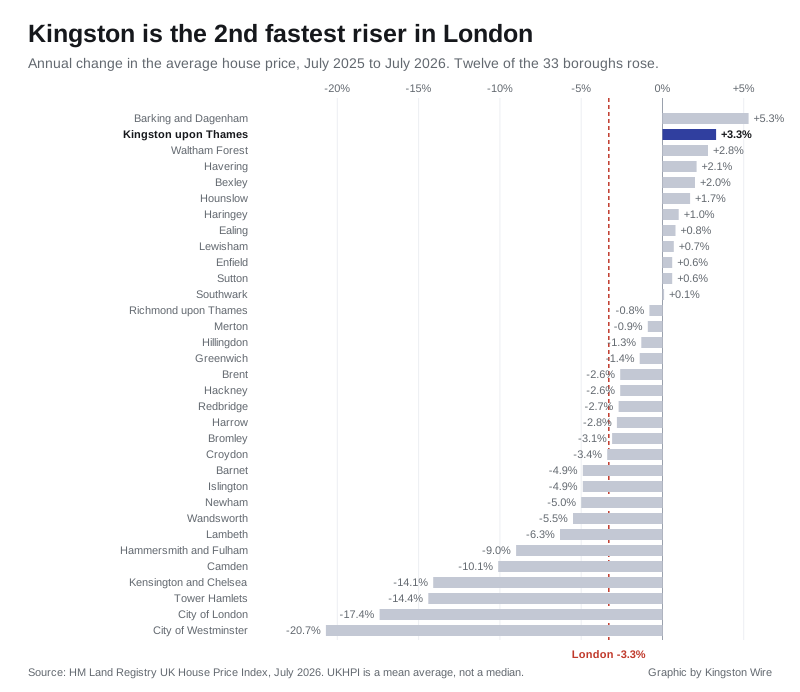
The pattern in that chart is not really about Kingston. It is about flats in inner London. The boroughs at the bottom are the ones with the most of them, and the flat index is where the damage is: down 17.5% in the City of London, 15.4% in Kensington and Chelsea, 14.6% in Tower Hamlets. Kingston’s flats rose 1.1%.
The part that does not fit the headline
Two things cut against the good news, and both are in the same release.
The borough’s average fell on the month. July’s £591,555 is £3,682 below June’s £595,237, a drop of 0.6%. Every property type fell: detached 0.1%, flats 1.0%, semis 0.5%, terraced 0.4%.
Kingston is still below where it started. The UKHPI index is set to 100 in January 2023. Kingston reads 99.2. After three and a half years, and a year of being one of the fastest risers in London, the borough’s average is still fractionally under its January 2023 level.
Underneath that, the types have split:
| Type | Average price | Year | Index (Jan 2023 = 100) |
|---|---|---|---|
| Detached | £1,304,915 | +4.9% | 100.4 |
| Semi-detached | £812,491 | +4.8% | 101.9 |
| Terraced | £591,784 | +4.7% | 101.8 |
| Flat or maisonette | £364,805 | +1.1% | 95.4 |
Houses have passed their January 2023 level. Flats have not, and at 95.4 they are still about £17,600 below where the index says they were. That gap is what holds the borough average under 100, because the flat is the cheapest way into Kingston and there are a lot of them.
The first-time buyer average is £473,349, up 3.0% on the year, and its index is 98.4. A first-time buyer is still buying at slightly less than the January 2023 equivalent, which is the one genuinely encouraging line in the release.
Against the neighbours
| Area | Average price | Year |
|---|---|---|
| Richmond upon Thames | £803,249 | -0.8% |
| Elmbridge | £748,080 | +1.9% |
| Merton | £615,890 | -0.9% |
| Kingston upon Thames | £591,555 | +3.3% |
| Epsom and Ewell | £568,214 | +2.0% |
| Sutton | £452,654 | +0.6% |
| Croydon | £390,041 | -3.4% |
Kingston is closing on Merton, which is £24,335 dearer and falling while Kingston rises. It is £211,694 cheaper than Richmond across the bridge, and £23,341 dearer than Epsom and Ewell over the Surrey boundary. Elmbridge, the borough on the far side of the Thames through Hampton Court and Thames Ditton, remains £156,525 out of reach.
A correction, and why the figures move
We published the June figure as £594,498, up 2.9%, in our June report. Land Registry has since revised June up to £595,237, up 3.1%. May has also been revised, from £576,609 to £580,185.
This is normal and it is worth understanding, because it happens every month. The index is built from completed sales as they are registered, and registrations arrive late. Each release therefore restates the previous few months. It means any single month’s figure for Kingston should be read as provisional for a while, and it is the reason we re-check the past months on every release rather than carrying our own earlier numbers forward.
What it means for you
If you are selling, the annual figure is the one worth quoting and the monthly one is not. A 3.3% year in a city that fell 3.3% is a real advantage. A 0.6% monthly dip on a mean average across roughly a few hundred sales is noise.
If you are buying a flat, Kingston is one of the few parts of London where flats rose at all this year, but they are still 4.6% below the January 2023 index. That is a weaker market than the house market around it, and it is where the negotiating room is.
If you are buying a house, the opposite applies. Detached, semi-detached and terraced all rose between 4.7% and 4.9% over the year and all three have passed their January 2023 level.
If you are remortgaging or appealing a valuation, use the type-level figures above rather than the borough average. The gap between a Kingston flat at £364,805 and a Kingston detached house at £1,304,915 makes the single borough number close to meaningless for any individual property.
Our Kingston house prices page carries the longer run of figures, the picture by ward and how the borough compares over time. For what the tax on that property costs, see Kingston council tax bands.
Sources
- UK House Price Index, Kingston upon Thames, July 2026, HM Land Registry, for the borough average, the annual and monthly change, the split by property type, the first-time buyer average and every index figure.
- The same UKHPI dataset, read region by region on 19 September 2026, for all 33 London boroughs, for London and England, and for Elmbridge, Epsom and Ewell, Merton, Sutton, Croydon and Richmond upon Thames. The borough ranking in the chart was compiled by hand from those readings.
- HM Land Registry’s June and May 2026 figures for Kingston, re-read on 19 September 2026, for the revisions noted above.
UKHPI is a mean average of registered sales, not a median, and monthly figures for a single borough are revised for several months after first publication. Figures published under the Open Government Licence.
Have your say