
The average Kingston home reached £594,498 in June, up £17,017 in a year. Kingston was London's fourth-biggest riser of 33 boroughs as the capital fell.
The average home in the Royal Borough of Kingston upon Thames was worth £594,498 in June 2026. That is £17,017 more than a year earlier, a rise of 2.9%.
Across London as a whole, prices went the other way. The capital’s average fell 2.5% over the same twelve months, to £553,870. England rose 1.8%, to £293,262.
The figures come from the UK House Price Index, published by HM Land Registry on 19 August 2026.
Kingston was one of only 14 boroughs to rise
We checked all 33 London boroughs on the same June data. Nineteen fell over the year and 14 rose. Kingston was the fourth-strongest of the lot.
The four biggest risers were:
- Barking and Dagenham, up 4.3% to £371,030
- Havering, up 3.9% to £456,759
- Redbridge, up 3.6% to £495,977
- Kingston upon Thames, up 2.9% to £594,498
The split is geographic, and Kingston sits on the right side of it. The steepest falls were all inner London: Westminster down 25.4%, Kensington and Chelsea down 14.7%, Hammersmith and Fulham down 13.3%, Wandsworth down 5.2%.
How that compares with the districts around us
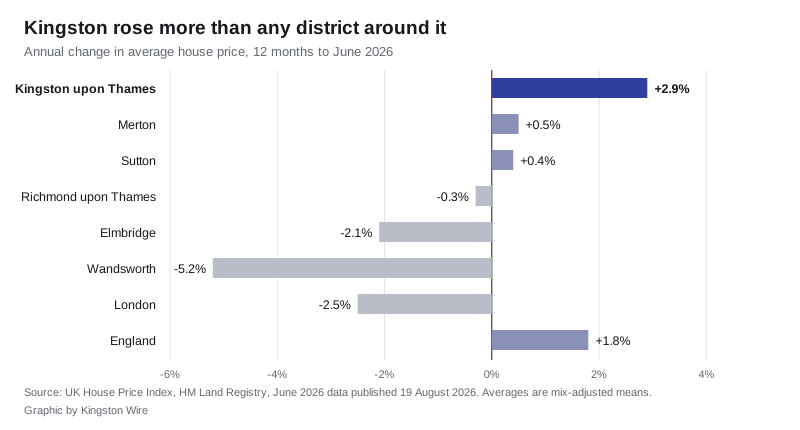
Kingston did better over the year than every district around it.
| Area | Average price | Annual change |
|---|---|---|
| Kingston upon Thames | £594,498 | +2.9% |
| Merton | £612,681 | +0.5% |
| Sutton | £446,775 | +0.4% |
| Richmond upon Thames | £818,949 | -0.3% |
| Elmbridge | £743,525 | -2.1% |
| Wandsworth | £680,105 | -5.2% |
| London | £553,870 | -2.5% |
| England | £293,262 | +1.8% |
Kingston has now overtaken Elmbridge and Wandsworth on the annual measure while sitting well below both on price. It remains cheaper on average than Richmond, by £224,451.
Terraces and semis did the work
The rise was not spread evenly across the market. Terraced houses and semi-detached homes moved most; flats barely moved at all.
| Property type | Average price | Annual change |
|---|---|---|
| Detached | £1,303,341 | +2.4% |
| Semi-detached | £815,150 | +3.7% |
| Terraced | £592,746 | +4.4% |
| Flat or maisonette | £368,299 | +1.6% |
That gap matters for anyone trying to move up. A Kingston flat and a Kingston semi were £423,259 apart in June, and the distance grew over the year rather than shrinking.
Prices are up on the year, and still short of January 2023
The index is the second thing worth reading here. UK HPI sets January 2023 at 100, and Kingston’s June reading was 99.7. The borough average in January 2023 was £596,139, so on this measure homes are still worth slightly less than they were three and a half years ago.
The picture varies by type:
- terraced homes are at 102.0, above their January 2023 level
- semi-detached homes are at 102.2, also above it
- detached homes are at 100.3, roughly level
- flats are at 96.3, still 3.7% below
Flats are the drag. The average Kingston flat sold for £382,375 in January 2023 and £368,299 in June 2026, £14,076 less in cash terms before inflation is considered.
First-time buyers
A first-time buyer in Kingston paid an average of £476,391 in June, up 3.0% on the year. That is £4,762 more than the London first-time buyer average of £471,629, and nearly double the England figure of £245,450.
One caution about the May figure
UK HPI revises earlier months every time it publishes, as more completed sales reach the register. Kingston’s May 2026 average now stands at £576,609, a 1.0% fall on the year. June’s 2.9% rise is therefore a genuine swing in the data rather than a continuation, and next month’s release may move May and June again. HM Land Registry explains the process in its guidance on revisions.
What it means for you
- If you are selling. The borough average is a mix-adjusted mean across every sale, not a valuation of your street. Terraced and semi-detached sellers are on the stronger side of this release; flat owners are not.
- If you are buying a flat. Kingston flats are the one part of the market still below the January 2023 index level. That is the clearest bargaining point in these figures.
- If you are watching for a turn. One month is not a trend, especially given the revisions above. The July 2026 figures are published at 9.30am on Wednesday 16 September 2026.
- Read the average correctly. UK HPI is a mean, not a median, and it is adjusted for the mix of property types sold. Our Kingston house prices page sets the mean against the median from individual Land Registry sales and breaks the borough down ward by ward.
- Context on supply. Kingston’s own housing land supply position sits behind a lot of this. We cover it on our Kingston planning page.
Update, 19 September 2026. HM Land Registry has since revised the June figures in its July release. The borough average for June has been revised up from £594,498 to £595,237, and the annual change from 2.9% to 3.1%. The May figure has been revised from £576,609 to £580,185. UKHPI restates recent months as late sale registrations arrive, so the figures below are the ones published on 19 August 2026. Our July 2026 report carries the current numbers.
Sources
- UK House Price Index, Kingston upon Thames, June 2026, HM Land Registry, for every Kingston figure above.
- UK House Price Index, London, June 2026 and England, June 2026.
- UK House Price Index for June 2026, published 19 August 2026, and the summary report for the next release date.
- Borough comparisons drawn from the same June 2026 UK HPI data for all 33 London boroughs, plus Merton, Sutton, Richmond upon Thames, Elmbridge and Wandsworth.
- ONS local house price tool for Kingston upon Thames.
Contains HM Land Registry data (c) Crown copyright and database right 2026, licensed under the Open Government Licence v3.0.
Have your say