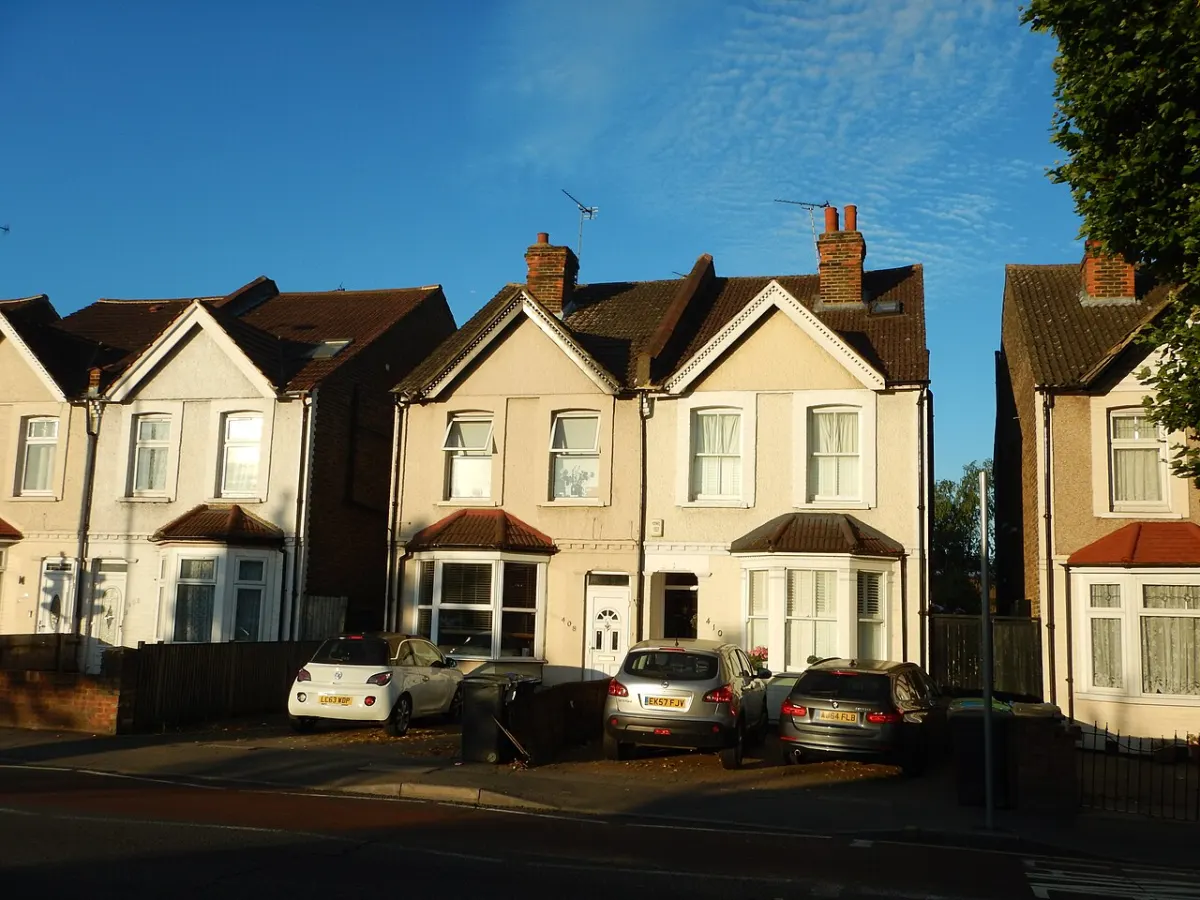

The typical Kingston borough home sold for £553,350, from 1,270 Land Registry sales. Ward medians run from £900,000 in Tudor to £410,000 in Surbiton Hill.
Two official records tell you what homes in the Royal Borough of Kingston upon Thames are worth, and they answer slightly different questions. The UK House Price Index gives a borough-wide average, adjusted for the mix of properties sold. HM Land Registry’s Price Paid record gives every individual completed sale, which is what lets you see the gap between Coombe and Chessington. This page uses both. Asking prices are not in here.
What a Kingston home actually sold for
Across the 12 months to July 2026, 1,270 homes sold in the borough at a median price of £553,350. That is the middle sale: half of Kingston’s homes went for less, half for more. The mean was higher at £648,769, pulled up by a handful of very large sales in Coombe.
Those figures come from HM Land Registry’s Price Paid data, filtered to the Kingston upon Thames local authority district and to standard market transactions only. Records completed between 1 August 2025 and 26 June 2026 are included; the most recent weeks are thin because sales take time to register, so the last month or two will fill in.
The spread matters as much as the middle. A quarter of Kingston sales came in under £390,500, and 25.7% were under £400,000, almost all of them flats. At the other end, 12.3% of sales passed £1 million.
| Property type | Sales | Median price |
|---|---|---|
| Detached | 119 | £1,150,000 |
| Semi-detached | 380 | £769,000 |
| Terraced | 284 | £589,000 |
| Flat or maisonette | 487 | £370,000 |
Flats are the single biggest slice of the Kingston market, 38% of all sales, and they are what keeps the borough median below three-quarters of a million. The step from a flat to a semi is roughly £400,000.
Ward by ward
The borough average hides a range of more than £490,000 between its most and least expensive wards. These medians come from the same Land Registry pull, with each sale’s postcode mapped to its ward through postcodes.io. Wards with fewer than 15 sales are not shown.
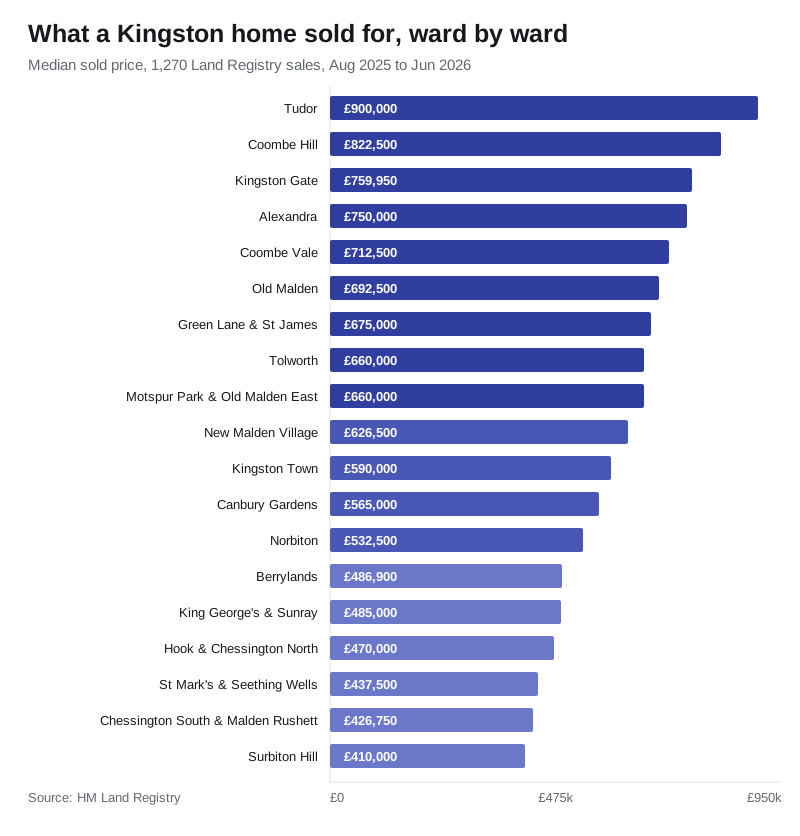
The pattern runs north-east to south-west. Tudor (£900,000), Coombe Hill (£822,500), Kingston Gate (£759,950) and Coombe Vale (£712,500) occupy the high ground between Kingston Hill and Richmond Park, where large interwar detached houses on big plots set the tone. The borough’s largest recorded sale in the period was a house on Warren Road, Coombe, at £7,280,000.
At the other end, Surbiton Hill (£410,000), Chessington South and Malden Rushett (£426,750) and St Mark’s and Seething Wells (£437,500) are the flat-heavy wards. St Mark’s and Seething Wells alone recorded 142 sales, more than any other ward, which tells you how much of Surbiton’s housing stock is purpose-built and converted flats near the station.
A ward median is not a street price. Chessington South and Malden Rushett runs from flats above the Broadway shops to detached houses backing onto the Green Belt, and its median sits between the two.
Commuting explains part of the spread. Surbiton reaches Waterloo in 17 minutes against 39 from Chessington South, and the fares differ by zone too, which is priced into the streets around each station.
By postal town
The postal towns cut the same data differently, and one of them is misleading unless you know what it covers.
- New Malden (KT3): £670,000 from 200 sales. The highest of the four, because the KT3 stock is dominated by houses rather than flats.
- Kingston upon Thames (KT1, KT2): £655,000 from 417 sales. This spans both town-centre flats and the Coombe estates, so the middle is broad.
- Surbiton (KT5, KT6): £486,000 from 427 sales. The lowest headline of the three, but the postal town also covers Tolworth, Hook Rise and Berrylands, not just Surbiton proper.
- Chessington (KT9): £450,000 from 181 sales.
How Kingston sits against London
On the mix-adjusted index, the average Kingston home was worth £591,555 in July 2026, the most recent month published. That is 3.3% up over the year, a rise of £19,128.
That reads better still against the capital. Over the same twelve months the London average fell 3.3% to £550,037, while England rose 1.1% to £293,479. Only 12 of London’s 33 boroughs rose at all, and Kingston was the second-strongest of them, behind Barking and Dagenham. We set out the full borough ranking in our report on the July 2026 figures.
| Area | Average price | Annual change |
|---|---|---|
| Kingston upon Thames | £591,555 | +3.3% |
| London | £550,037 | −3.3% |
| England | £293,479 | +1.1% |
The borough sits about £41,500 above the London average, which is unusual for an outer borough and reflects Coombe, Kingston Hill and the family-house belt. The composition is distinctive too: a Kingston detached house averages £1,304,915 against £1,167,718 across London, while a Kingston flat averages £364,805 against £424,013 for London. Houses here carry a premium; flats are cheaper than the London norm.
A first-time buyer in the borough paid an average of £473,349 in July 2026, up 3.0% on the year, against a London first-time-buyer average of £466,851 that fell 4.0%.
Why the index and the sales record differ
You will see £591,555 in one place on this page and £553,350 in another. Both are right.
The index average is mix-adjusted and modelled: it estimates what a typical home is worth, smoothing out the fact that an unusually flat-heavy month would otherwise look like a price crash. The Land Registry median is raw: it is literally the middle of what changed hands, so it moves with what people happened to buy.
One filter is worth spelling out because it changes the answer. Land Registry flags some sales as additional price paid transactions, meaning they were not at full market value: repossessions, part-share purchases, portfolio transfers. The department says not to use them for market analysis, and they are not rare here. Of the 1,480 Kingston records in the period, 210 were flagged that way, 14% of the total, and they are excluded from every figure on this page.
Checking a specific address
Every completed sale in England and Wales is public. Search a street or a single address free on HM Land Registry Price Paid. Before you commit to anything, check the council tax band too, since that bill is a running cost of the property that buyers routinely leave out of the sums.
What gets built next matters as well. The borough can show only 1.48 years of deliverable housing land, and its draft Local Plan proposes nearly 20,000 homes by 2043, including Green Belt release. Our Kingston planning page sets out the figures and the consultation deadline.
Frequently asked questions
What is the average house price in Kingston upon Thames?
The mix-adjusted average was £591,555 in July 2026 on the UK House Price Index. The median actual sale over the year to July 2026 was £553,350 across 1,270 Land Registry transactions.
Are Kingston house prices rising or falling?
Rising, on the latest figures. Prices were up 3.3% over the year to July 2026, while London as a whole fell 3.3%.
Which is the most expensive part of Kingston borough?
Tudor ward, at a £900,000 median, followed by Coombe Hill at £822,500. Both sit on the high ground between Kingston Hill and Richmond Park.
Where are the cheapest homes in the borough?
Surbiton Hill ward, at a £410,000 median, then Chessington South and Malden Rushett at £426,750. Both are flat-heavy, which is what pulls the middle down.
How much is a flat in Kingston?
The median flat or maisonette sold for £370,000 over the year to July 2026, from 487 sales. That is the largest single category of sale in the borough.
Is Kingston more expensive than the rest of London?
Yes, slightly. The borough average of £591,555 is about £41,500 above the London average of £550,037. The premium is concentrated in houses, not flats.
Sources
- UK House Price Index, Kingston upon Thames (ONS and HM Land Registry) for the mix-adjusted average, property-type averages and first-time-buyer figure.
- UK House Price Index linked data API for the July 2026 Kingston figures, and the London and England comparisons.
- HM Land Registry Price Paid data for the 1,270 individual sales behind the medians, by type, ward and postal town.
- postcodes.io for mapping each sale’s postcode to its ward.
- HM Land Registry Price Paid search to look up an individual address.
Land Registry figures are provisional and revised as more sales register. Check the linked sources before making a decision.
Have your say