
Kingston had 3,720 claimants in June, 85 fewer than a year ago, but under-25 claims rose to 555. Norbiton is on 5.0 per cent, Tudor on 2.0. Ward by ward.
Kingston borough had 3,720 people claiming unemployment-related benefits in June 2026, 85 fewer than in June last year but 60 more than in May, according to figures published by the Office for National Statistics through Nomis.
That works out at 3.3 per cent of borough residents aged 16 to 64, well below the London figure of 5.6 per cent.
The headline fall hides a split. Claims by people aged 25 to 49 dropped by 140 over the year, from 2,330 to 2,190. Claims by people under 25 went the other way, rising from 525 to 555. The over-50s edged up too, from 950 to 975.
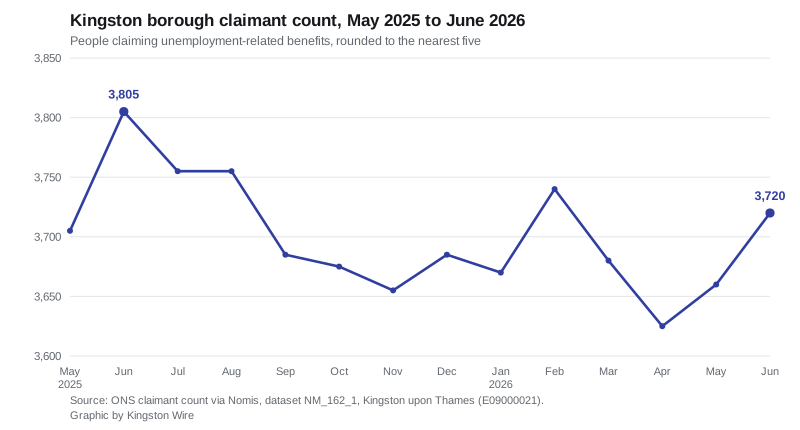
Over the past 14 months the count has moved in a narrow band. The high was 3,805 in June 2025 and the low was 3,625 in April 2026. June’s rise of 60 on the month is the sort of movement that shows up most summers as school and university leavers register, which is also consistent with the under-25 increase.
What the claimant count actually measures
This is not the unemployment rate. The claimant count records people receiving Universal Credit who are required to look for work, plus the remaining Jobseeker’s Allowance claimants. It leaves out anyone unemployed who does not claim, and it includes some people who are working but on low enough earnings to still be required to seek more.
ONS rounds every figure in this series to the nearest five, so small month-to-month movements should be read as a direction rather than an exact count.
Ward by ward
Ward figures are published for the same month and add up exactly to the borough total of 3,720. The spread across the borough is wide: Norbiton is at 5.0 per cent, two and a half times the 2.0 per cent recorded in Tudor.
| Ward | Claimants | % of residents aged 16-64 |
|---|---|---|
| Norbiton | 410 | 5.0% |
| Kingston Town | 310 | 3.6% |
| Tolworth | 305 | 3.9% |
| St Mark's & Seething Wells | 295 | 3.2% |
| Surbiton Hill | 245 | 3.2% |
| Hook & Chessington North | 230 | 3.2% |
| New Malden Village | 220 | 3.7% |
| Kingston Gate | 200 | 2.7% |
| Coombe Vale | 175 | 2.6% |
| Green Lane & St James | 175 | 3.9% |
| Chessington South & Malden Rushett | 165 | 2.7% |
| Canbury Gardens | 160 | 2.9% |
| Coombe Hill | 160 | 3.4% |
| King George's & Sunray | 140 | 3.8% |
| Old Malden | 140 | 3.5% |
| Motspur Park & Old Malden East | 130 | 3.0% |
| Alexandra | 95 | 2.3% |
| Tudor | 85 | 2.0% |
| Berrylands | 80 | 2.1% |
Note that the count and the rate rank differently. Green Lane and St James has 175 claimants, the same as Coombe Vale, but a much higher rate at 3.9 per cent against 2.6 per cent, because it has a smaller working-age population. The ward series only begins with the May 2025 ward boundaries, so there is no year-earlier ward figure to compare against yet.
How Kingston compares
| Area | Claimants | % of residents aged 16-64 |
|---|---|---|
| Richmond upon Thames | 3,285 | 2.6% |
| Kingston upon Thames | 3,720 | 3.3% |
| Sutton | 4,740 | 3.5% |
| Wandsworth | 10,115 | 4.0% |
| Merton | 6,810 | 4.6% |
| London | 353,355 | 5.6% |
Of the south-west London boroughs, only Richmond does better, and Richmond and Kingston are the two that share a border here. Kingston sits a long way below the London average, and the gap has held steady through the past year.
What it means for you
If you are claiming, the council’s benefits and support pages are the starting point for what you can apply for locally. The under-25 figure is the one to watch over the next two releases, because a summer rise that does not unwind by the autumn is a different signal from one that does.
The council is not blind to the youth side of this. On 10 July it hosted the first Youth Futures Summit with the South London Partnership, an event the council says drew more than 100 people and was informed by the South London Youth Integration Network’s work with over 10,000 young people. Whether that shifts the claimant figures is something these monthly releases will show over the next year, not the next month.
For anyone reading this as a measure of the local economy, treat it as one indicator among several. A 3.3 per cent claimant rate alongside an average borough house price of £582,403 is the more useful pairing: Kingston’s problem is far more visibly the cost of housing than the availability of work.
The next monthly release covers July 2026 and is due in September.
Sources
- ONS claimant count, dataset NM_162_1, via Nomis for the borough, age and comparison figures, and the same dataset at ward level for the ward table.
- Kingston Council, Youth Futures Summit, published 21 July 2026.
- Figures are Crown copyright, published under the Open Government Licence.
Update, 16 September 2026
The ONS has since revised the June 2026 figures. The borough total is now 3,670 rather than 3,720, so the rise on May was 10, not 60, and the rate is 3.2 per cent rather than 3.3. The revised age split for June is 550 claimants aged 16 to 24, 2,150 aged 25 to 49 and 965 aged 50 and over. Ward figures have moved by similar small amounts. The article above reports the figures as first published. For the latest release, see our August 2026 claimant count story.
Have your say