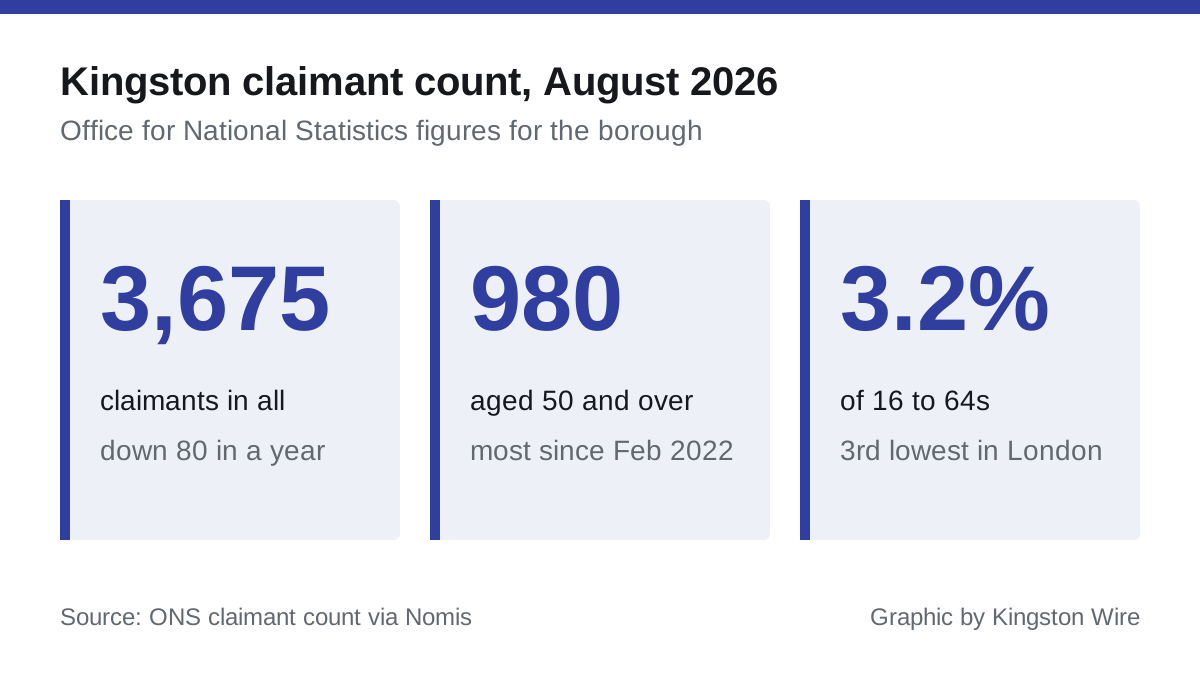

980 Kingston claimants were aged 50 or over in August, the most since February 2022, while the borough total fell 80 in a year to 3,675. Figures ward by ward.
More people aged 50 and over are claiming unemployment-related benefits in Kingston than at any point since February 2022. The borough had 980 claimants in that age group in August 2026, up 65 on a year earlier.
The overall count went the other way. Kingston had 3,675 claimants in August, 80 fewer than in August 2025. That is 3.2 per cent of residents aged 16 to 64.
The figures come from the Office for National Statistics claimant count, published through Nomis on 15 September.
Older claimants up, prime-age claimants down
The year’s movement splits sharply by age:
| Age group | August 2025 | August 2026 | Change |
|---|---|---|---|
| 16 to 24 | 545 | 555 | +10 (+1.8%) |
| 25 to 49 | 2,295 | 2,140 | -155 (-6.8%) |
| 50 and over | 915 | 980 | +65 (+7.1%) |
| All ages | 3,755 | 3,675 | -80 (-2.1%) |
London as a whole does not show the same over-50s rise. Across the capital, claimants aged 50 and over went from 89,925 to 90,025 in the same year, an increase of 0.1 per cent. The London figures show the fall in 25 to 49 year olds too, but it is smaller there, at 2.8 per cent.
The Kingston rise is among both men and women. Men aged 50 and over went from 500 to 530, and women from 415 to 450.
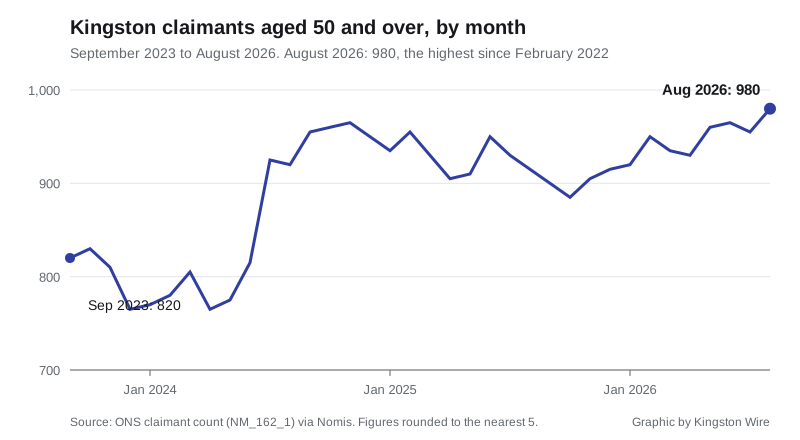
The over-50s count has not moved in a straight line. It stood at 820 in September 2023, jumped above 900 in the summer of 2024 and has stayed there since. The last time it was as high as 980 was January and February 2022, when the count was still coming down from a high of 1,535 in March 2021.
Over-50s now make up 26.7 per cent of Kingston’s claimants, against 25.9 per cent across London.
How Kingston compares
Kingston’s rate is the third lowest of the 33 London local authorities. Only the City of London (1.1 per cent) and Richmond upon Thames (2.6 per cent) are lower, according to the borough-by-borough table.
| Area | Claimants | % of residents aged 16-64 | Change in claimants since Aug 2025 |
|---|---|---|---|
| Richmond upon Thames | 3,180 | 2.6% | +20 |
| Kingston upon Thames | 3,675 | 3.2% | -80 |
| Sutton | 4,755 | 3.5% | +105 |
| Wandsworth | 10,070 | 4.0% | -205 |
| Merton | 6,715 | 4.5% | -155 |
| London | 347,135 | 5.5% | -3,555 |
Ward by ward
The 19 ward figures add up exactly to the borough total of 3,675. Norbiton has the highest rate at 4.9 per cent. Tudor has the lowest at 2.0 per cent.
Tolworth has risen two months running, from 305 in June to 315 in July and 330 in August. That is its highest count since the ward series began in January 2026. Its rate is now 4.2 per cent, second only to Norbiton.
| Ward | July | August | August % of 16-64s |
|---|---|---|---|
| Norbiton | 395 | 405 | 4.9% |
| Tolworth | 315 | 330 | 4.2% |
| St Mark's & Seething Wells | 305 | 300 | 3.2% |
| Kingston Town | 295 | 290 | 3.3% |
| Surbiton Hill | 225 | 245 | 3.2% |
| Hook & Chessington North | 230 | 225 | 3.1% |
| New Malden Village | 210 | 220 | 3.7% |
| Kingston Gate | 205 | 190 | 2.6% |
| Coombe Vale | 185 | 180 | 2.8% |
| Green Lane & St James | 165 | 170 | 3.9% |
| Chessington South & Malden Rushett | 170 | 165 | 2.7% |
| Coombe Hill | 150 | 155 | 3.3% |
| King George's & Sunray | 145 | 145 | 3.9% |
| Canbury Gardens | 140 | 140 | 2.5% |
| Old Malden | 135 | 135 | 3.3% |
| Motspur Park & Old Malden East | 125 | 115 | 2.7% |
| Alexandra | 100 | 100 | 2.4% |
| Tudor | 75 | 85 | 2.0% |
| Berrylands | 85 | 80 | 2.1% |
Ward figures come from the same dataset at ward level. Every figure is rounded to the nearest five, so a move of five or ten in a ward is within the noise.
What the claimant count measures
This is not the unemployment rate. The ONS says the claimant count “does not attempt to measure unemployment”. It measures “the number of people claiming benefits principally for the reason of being unemployed, based on administrative data from the benefits system”, according to its quality and methodology note.
Under Universal Credit, that includes some people who are in work on low earnings and must look for more. It leaves out people who are out of work but do not claim.
What it means for you
- If you are 50 or over and looking for work, the council lists local training and job support on its skills and employment hub. Its past jobs fairs at the Guildhall took referrals through Jobcentre work coaches.
- If you need help with money while you look, the council’s benefits and support pages are the starting point.
- If you want free or cheap courses, Kingston Adult Education runs essential skills courses in English, maths and digital skills.
A rise of 65 in a year is not a crisis in a borough of Kingston’s size. But it runs against both the borough’s falling total and London’s flat over-50s figure, and August’s rise of 25 on July took it to its highest level in more than four years. The September figures are due in October.
Correction to earlier figures
The ONS has revised its June 2026 figures since we reported them on 14 August. June’s borough total is now 3,670, not 3,720, so the rise on May was 10 rather than 60. We have added a note to our June story.
Sources
- ONS claimant count, dataset NM_162_1, via Nomis: borough by age, London boroughs and wards. Updated 15 September 2026.
- ONS, Claimant Count quality and methodology information.
- Figures are Crown copyright, published under the Open Government Licence.
Have your say