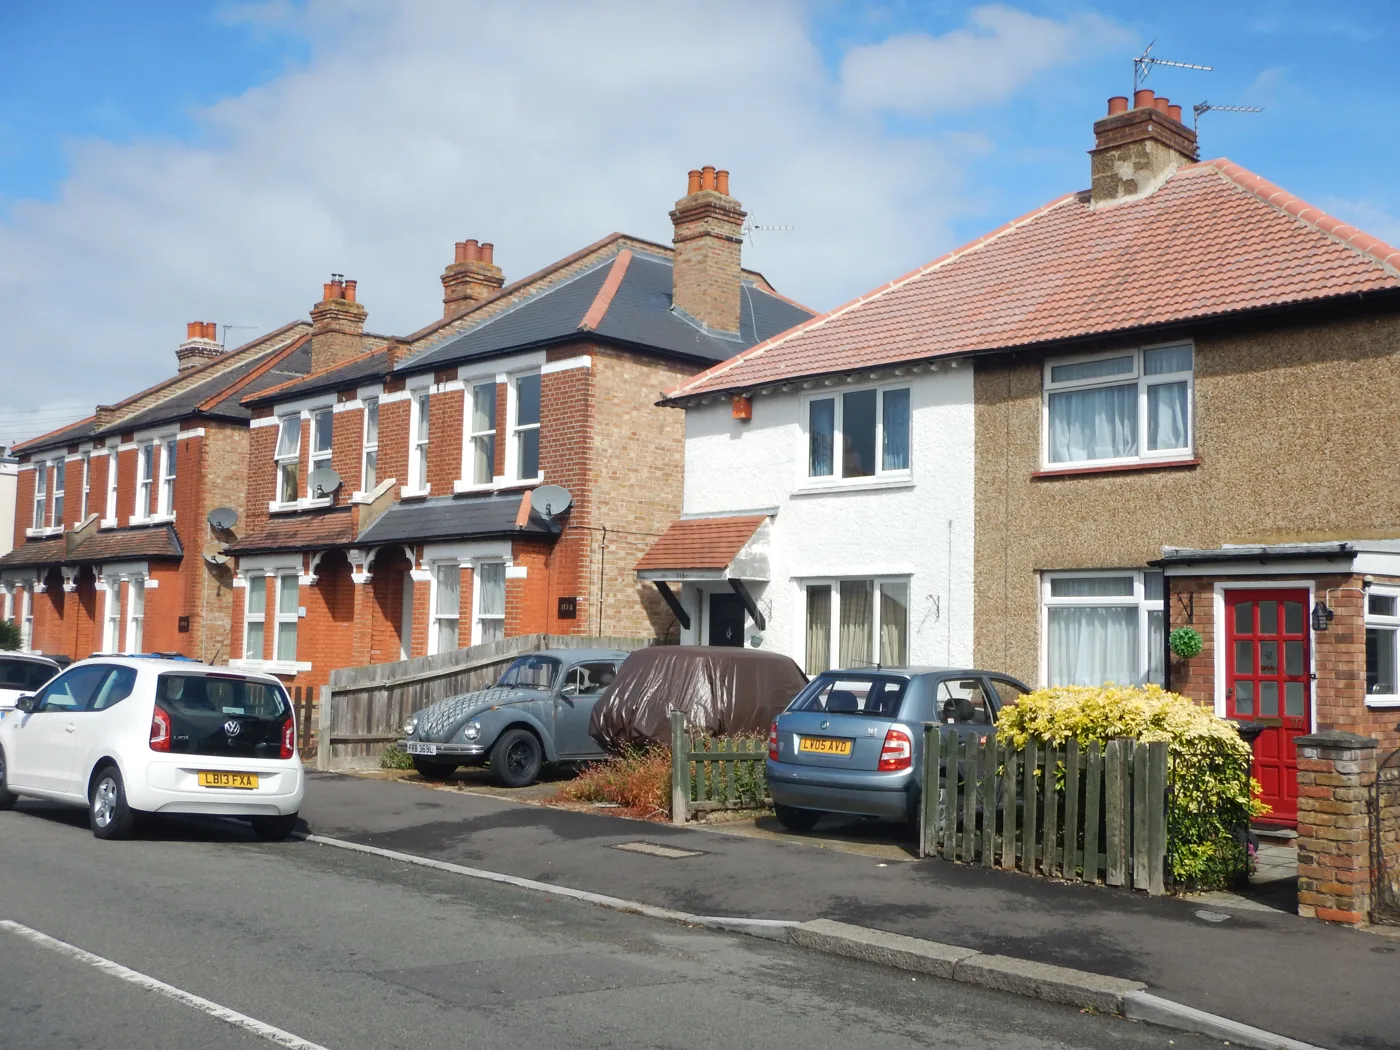

Kingston's average house price rose £27,645 in the year to August, to £597,587: the fastest rise of London's 33 boroughs while the capital fell 2.2%.
House prices in the Kingston upon Thames borough rose faster than anywhere else in London over the past year. The average home was worth £597,587 in August, up £27,645 on August 2025.
That is a rise of 4.9 per cent. London as a whole fell 2.2 per cent over the same year, and England rose 0.4 per cent.
The figures come from HM Land Registry’s UK House Price Index for August 2026, published on 21 October. UKHPI is a mean average, not a median, so a few big sales on Coombe Hill lift it more than a typical sale in Chessington or Tolworth.
Top of the London table
Kingston moved from second place in July to first in August. Barking and Dagenham, last month’s leader, is now second at 4.7 per cent.
Only nine of London’s 33 local authorities rose over the year. Two were flat and 22 fell.
| Area | Average price | Change on a year |
|---|---|---|
| Kingston upon Thames | £597,587 | +4.9% |
| Barking and Dagenham | £369,881 | +4.7% |
| Bexley | £414,833 | +1.9% |
| Ealing | £589,875 | +1.8% |
| Sutton | £458,954 | +1.5% |
| Tower Hamlets | £447,950 | -13.3% |
| Kensington and Chelsea | £1,204,072 | -13.8% |
| Westminster | £887,206 | -14.3% |
| City of London | £726,633 | -14.6% |
| London | £554,430 | -2.2% |
| England | £293,525 | +0.4% |
The other risers were Havering (1.1 per cent), Enfield (0.8 per cent), Waltham Forest (0.7 per cent) and Merton (0.1 per cent). Hillingdon and Richmond upon Thames were unchanged.
Back above where it started in 2023
The borough’s average also rose on the month, by 1.0 per cent, or £5,772 on July’s revised figure of £591,815.
That takes Kingston to its highest average since April 2023, when it stood at £607,571. The index, which is set at 100 for January 2023, now reads 100.2. It is the first time since April 2023 that the borough has been above its January 2023 level.
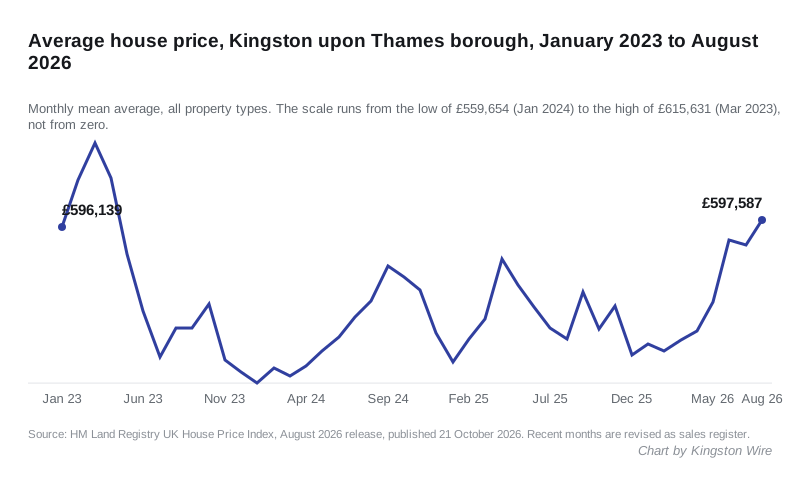
For most of the past three years the borough was below that level. The average peaked at £615,631 in March 2023, fell to £559,654 in January 2024, and then spent two years between roughly £560,000 and £590,000. The climb began in May 2026.
Houses lead, flats lag
Every property type rose, but houses rose much faster than flats:
| Type | August 2025 | August 2026 | Change | Index (Jan 2023 = 100) |
|---|---|---|---|---|
| Detached | £1,229,853 | £1,318,737 | +7.2% | 101.5 |
| Semi-detached | £772,387 | £821,443 | +6.4% | 103.0 |
| Terraced | £564,532 | £598,538 | +6.0% | 103.0 |
| Flat or maisonette | £359,204 | £368,099 | +2.5% | 96.3 |
Flats are still 3.7 per cent below their January 2023 level. All three house types are above theirs.
The first-time buyer average is £477,799, up 4.3 per cent on the year. Its index reads 99.4, so first-time buyers are still paying slightly less than the January 2023 equivalent. Buyers with a mortgage paid an average of £602,122, up 5.0 per cent. Cash buyers paid £580,651, up 4.4 per cent.
Against the neighbours
| Area | Average price | Change on a year |
|---|---|---|
| Richmond upon Thames | £813,931 | 0.0% |
| Elmbridge | £735,548 | +0.7% |
| Merton | £623,791 | +0.1% |
| Kingston upon Thames | £597,587 | +4.9% |
| Epsom and Ewell | £566,163 | +3.2% |
| Sutton | £458,954 | +1.5% |
| Croydon | £396,718 | -1.5% |
Merton is £26,204 dearer than Kingston. Kingston is £216,344 cheaper than Richmond and £31,424 dearer than Epsom and Ewell.
Why last month’s figures have changed
We reported July as £591,555, up 3.3 per cent, in our July story. Land Registry now puts July at £591,815, up 3.4 per cent. June has moved again too, to £592,967.
This happens every month. The index is built from completed sales as they are registered, and registrations arrive late. In June, the most recent month with a sales count, the borough’s figure rested on 103 recorded sales. With samples that small, August’s figure should be treated as provisional until the next two releases have restated it.
What it means for you
- If you are selling a house, the annual figure is the one worth quoting. Detached, semi-detached and terraced homes all rose by 6 per cent or more, in a city where most boroughs fell.
- If you are buying a flat, the market is softer. Flats rose 2.5 per cent and are still below their January 2023 level, which is where the room to negotiate is.
- If you are a first-time buyer, the average rose £19,703 in a year. It is still fractionally below its January 2023 level.
- For streets and recent sales near you, our Kingston house prices page has sale prices ward by ward.
The September figures are due from Land Registry in November.
Sources
- HM Land Registry, UK House Price Index for August 2026, published 21 October 2026.
- UKHPI data for Kingston upon Thames, August 2026, with the same series for each London borough, London, England and the neighbouring districts.
- Contains HM Land Registry data © Crown copyright and database right 2026, licensed under the Open Government Licence.
Have your say